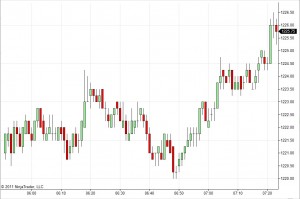
You may have noticed that modern markets behave in choppy and downright strange ways. Market price rarely moves from point A to point B without several false starts and weird twists along the way. This is true on a wide range of time scales – look at a daily chart of the S&P 500 or a minute by minute chart of oil prices, and you’ll see the same phenomenon. This chart from this morning’s S&P future pre-market is a perfect example:
 Overall you might look at this chart as say “price is going up”, and you’d be right. But oh, what a tortured path it took to get there. Note that over halfway across the chart price made new LOWS. Similarly, each of the largest upward movements was followed by downward movement somewhere in the next few bars. At some level, the human mind rebels at this sort of inconsistency – we like nice, neat, smooth movements from source to destination and the financial markets are not particularly inclined to oblige. To some extent this is simply the nature of markets, but the movement of the major markets was not always like this. It took work to get to this point – noise in the markets was invented, not found. And therein lies one of the most interesting stories in trading: the history of trend following.
If you go back far in time to the middle of the 20th century, markets moved much more smoothly and directly up or down then they do now. There are various ways to measure this, but by any reasonable mathematical criterion the markets of the mid to later half of the 20th century had a tendency to strong trends. This was especially true of commodities, but true of equities and bonds as well. And within the trading community this fact was known, and it was a popular aphorism to “trade with the trend”. Of course, the difficulty lay in precisely identifying the starts and ends of trends – even then the markets were noisy enough that it wasn’t an easy task.
Enter Richard Donchian. He developed two methods for mathematically defining the start and end of trends. The first was moving average crossover. The second was the Donchian channel (breakouts beyond historic highs or lows). Both were effective means of detecting trends – in the event of a long trend, it’s mathematically impossible not to trip both detectors. On the basis of these tools he founded a commodity fund, Futures Inc, which was the predecessor of modern mutual funds. That said, Donchian’s work never took a fundamental place at the center of the markets – he traded his fund’s capital and made a nice profit with the trends he discovered, wrote a popular advisory letter that was much more widely read than understood, and that was that. It’s interesting to note that Donchian made no attempt to keep his discovery secret, and yet it failed to achieve wide acceptance. Twenty five years after Donchian knew for a fact that equity and commodity markets strongly trended on certain time frames (he favored using the crossover of a 5-day and 20-day average), Burton Malkiel’s influential and utterly wrong book A Random Walk Down Wallstreet was published claiming the exact opposite. It’s hard to understand in the modern era how the two ideas could have co-existed – surely Donchian’s sound mathematical analysis must prevail over dogma. But you have to remember the times. Data was hard to come by and expensive. Computing power to analyze that data was not available to the layman. The idea that quantitative analysis was the best means to approach the financial markets was unknown – in fact the majority of major floor and desk traders lacked advanced education and were likely ignorant of much of mathematics. It was easy to believe whatever you wanted to believe.
Move forward to the mid-70’s, and things began to change. The most fundamental change was in the availability of computing power. While major financial firms had a bad tendency to view their computers as “business machines” for accounting and other menial tasks, a strain of rebels arose who started sneaking computer time to try to answer financial questions. Armed with datasets of historical prices, it was now possible to ask: what would have happened if I had traded strategy X in the past? In other words, the backtest was born. It became possible, with statistical rigor, to start answering questions about the behavior of the markets and how various trading strategies interacted with those markets. And the obvious first step was to take trading strategies that had already been published and test them and see if they worked.
I have no idea how many people had the same idea at the same time, but at least two independent groups took the information from Richard Donchian’s advisory letters and computer-tested his strategies. One was Ed Seykota and Michael Marcus. The other was Richard Dennis, eventually joined in the 80’s by William Eckhardt and a group of trading trainees they taught nicknamed “the turtles”. Both groups did essentially the same thing – proved via computer that Donchian’s trend following methods worked, made some minor tweaks to make them better, and then traded them with large amounts of capital. The results was some of the most continual success anyone has ever achieved in the realm of trading – over the subsequent years each group achieved high double digit to low triple digit percent returns the majority of years on increasingly large amounts of capital.
This had an interesting effect on the markets – it meant that any time the markets made long, sustained movements the neo-Donchian trend followers profited and everyone else lost. Eventually if things continued as before they’d have ended up with all the money in the world. Of course, things never got to that point – the markets have a weird way of fighting back. What other market participants noticed was that both of Donchian’s trend detectors are easily fooled – it’s possible to create false price movements that look like the start of a trend, but which have no economic force behind them. Once the trend-followers enter their position in that direction, the faux-trend can be allowed to die, causing losses for the trend follower as the market moves back to previous prices. This is the “false breakout” – the market’s immune system against trend followers. Interestingly the false breakouts created to thwart trend-following were never quite frequent enough to render the neo-Donchian systems unprofitable. Just less profitable.
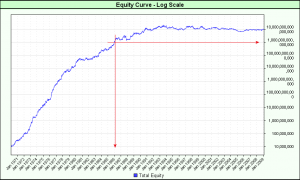
Three things happened next. First, word of the success of various trend followers got out and their strategies were published, stolen, and deduced. You can get the turtle strategy here:turtlerules. Second, computers became cheaply and commonly available. Third, good price data, including minute and even tick level data, became available. This resulted in a great expansion of the number of people who could do trend following research and the number of timeframes on which that research could be done. The genie was out of the bottle and profitable trend following systems were developed by numerous people on numerous time frames. This activity corresponded to the PC era – starting in about 1995 and continuing through the early 2000s. The market’s response to this second wave of trend followers was much more dramatic – false breakouts, previously only occasional things, became common on all time frames in all popular markets. And their frequency increased to the point where Donchian-style trendfollowing methods stopped working consistently. This is a chart of the simulated returns for the turtle system since 1970:  As you can see, around 1981 profitabilty dropped as false breakouts became more common, and around 1994 or so it stopped working. The timing is interesting since in most people perception the late 90’s was a very “trendy” time from a market perspective. But the rate of false breakouts had become sufficiently high that the Donchian/Turtle methods no longer worked.
And that’s where we are today – a large percentage of market movement is not in fact economic in origin. It’s simply a defense mechanism to camouflage the real economic movement and prevent trend following. The resulting markets are harder to trade. Ironically, Burton Malkiel was provably wrong in 1972, but is now a little closer to the truth – the amount of extra non-economic activity layered on top of market price is sufficiently high that the markets are much closer to random. They’re not truly random – with more sophisticated analysis than Donchian used, trends can still be found. But it’s much harder to do and more technical than it used to be.
Which is what makes this game so interesting.